Hi, I'm Feng Yuan.
A
self-motivated and proactive data analyst with a curious mind who enjoys solving complex and challenging real-world problems.
About
I am an enthusiastic, team-oriented, and experienced data analyst. With professional certifications in business analytics and statistics, I am dedicated to improving data-driven decision-making processes by extracting valuable insights from intricate datasets. Proficient in data analysis tools, visualization platforms, and various programming languages, I excel at transforming raw data into meaningful narratives.
- Data Analysis: Excel (Pivot tables, VLOOKUP, Advanced formulas), SQL (MySQL, SQL server), Python (NumPy, Pandas, Matplotlib), Alteryx
- Data visualization: Tableau, Power BI, SPSS
- Tools & Technologies: Microsoft Office Suite, Google Sheets, Google Analytics, Git, Bash
- Language: English, Mandarin
Looking for a Data Analyst or Business Analyst role.
Work Experiences
- Consistently achieves an accuracy rate exceeding 98% in evaluations through review, classification, and content refinement in alignment with client guidelines, using data analysis expertise to deliver valuable insights to Accenture clients.
- Maintains a customer satisfaction ranking within the top 10%, actively engaging in ongoing training initiatives and collaborative workgroup discussions to foster optimal growth within the role.
- Tools: Google Analytics, Google Sheets, Google Workspace
- Lead a team of 4 technical professionals through data ETL, analytics, and visualization to provide 24/7 operational support for a company with 6,000 employees.
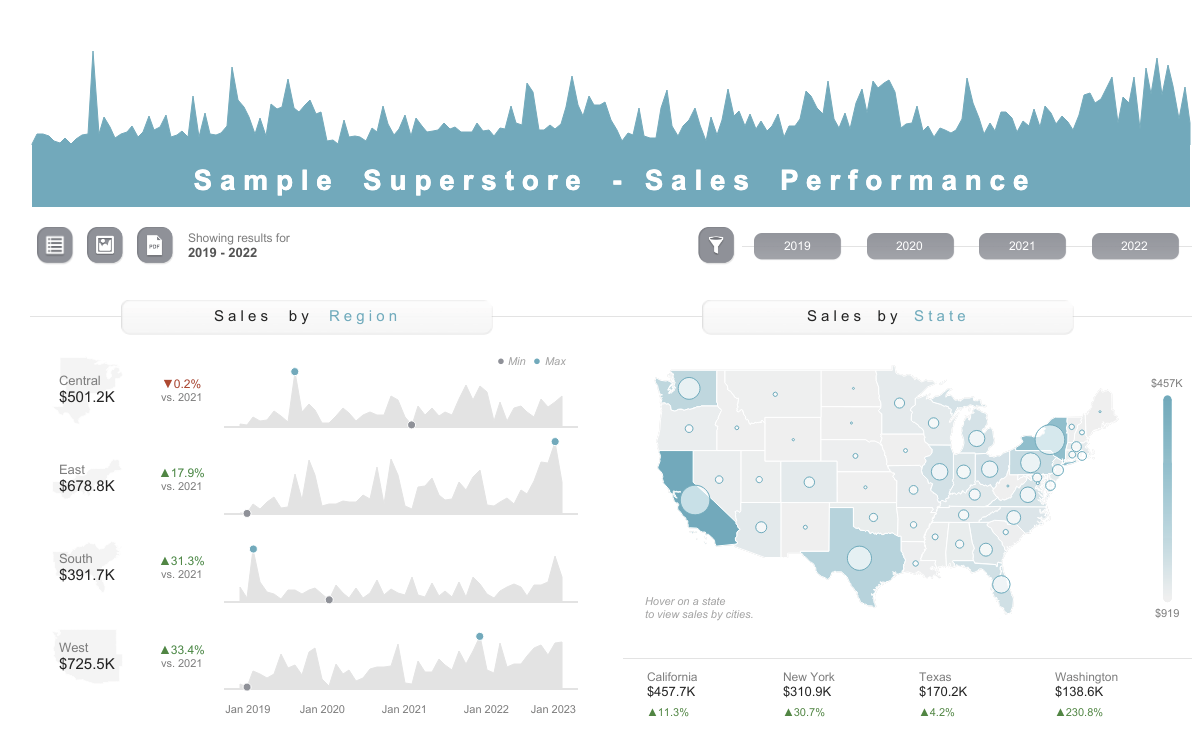
- Built a Tableau dashboard to visualize core business KPIs, including sales and profit margins, which resulted in saving 10 hours per week in manual reports.
- Visualized the growth trends of company products through Tableau and discussed the results with senior management to ensure data analysis quality, consistency, and accuracy. Contributed to the optimization of marketing strategies.
- Tools: Excel, PowerPoint, SQL, Python, Tableau, Power BI, SPSS, Alteryx
- Utilized A/B testing to optimize online social media marketing strategies, resulting in a 30% increase in media exposure and an 18% boost in audience engagement.
- Create Google Analytics dashboards, develop metrics, monitor real-time website data, and track customer behavior and engagement.
- Tools: Google Analysis, Weibo Data Analysis
Projects

By R & Python
- Tools: R, Python, Tableau
- Goal: To help Cyclistic boost annual members and drive profitable growth.
- Analyzing Cyclistic's historical bicycle trip data.
- Analyzing the behavior and preferences of casual riders versus annual members and comparing them to identify trends.
- Informing marketing strategies developed by Cyclistic based on analytical insights.
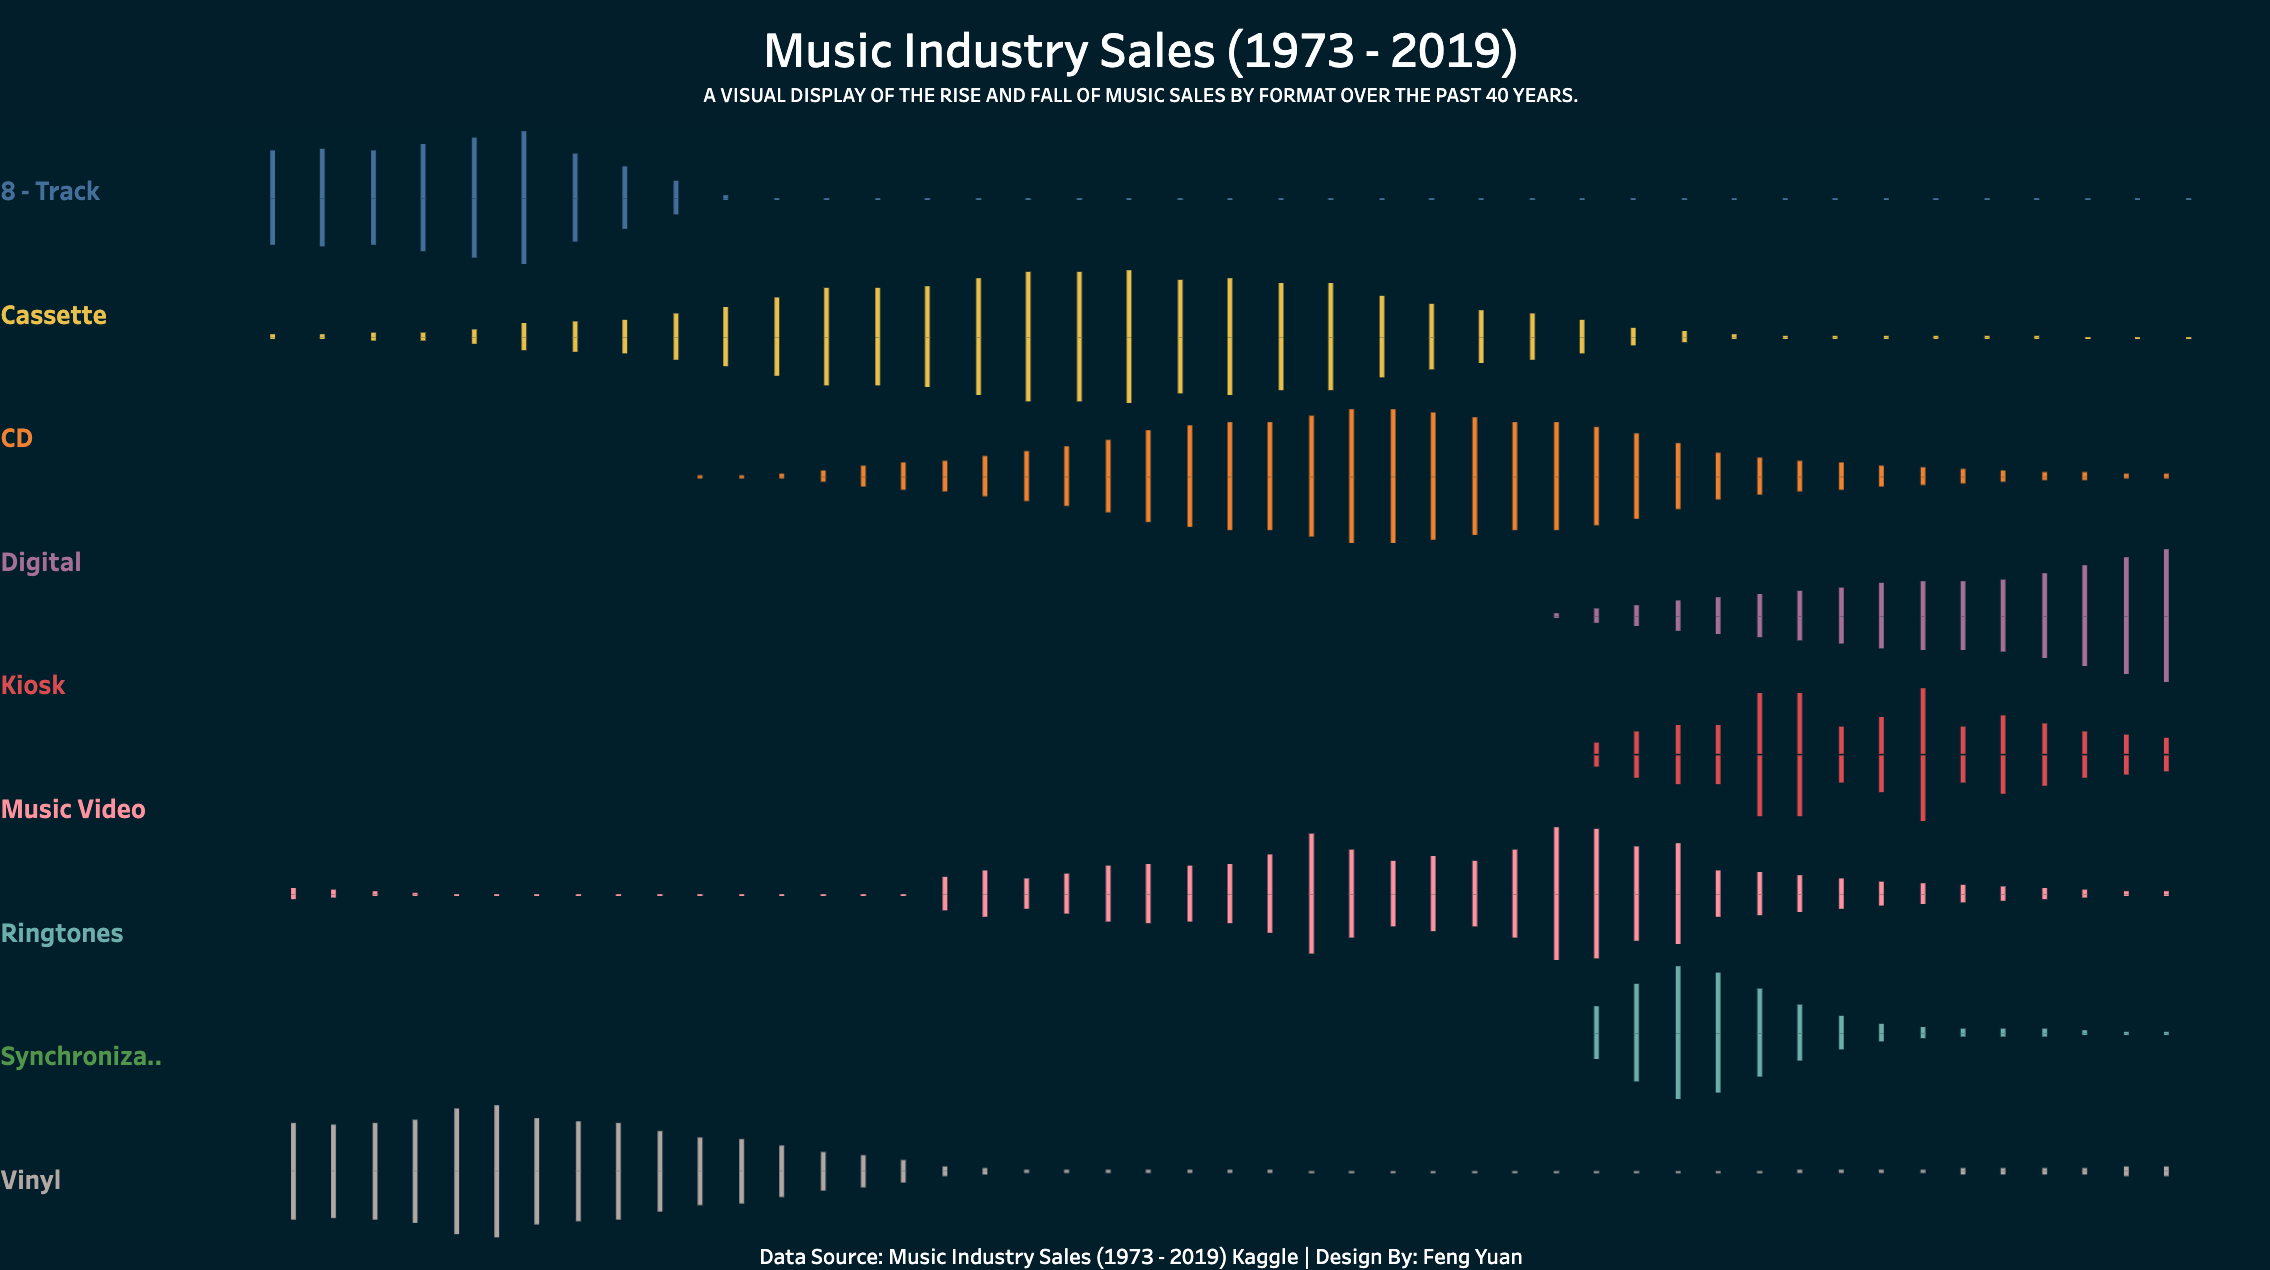
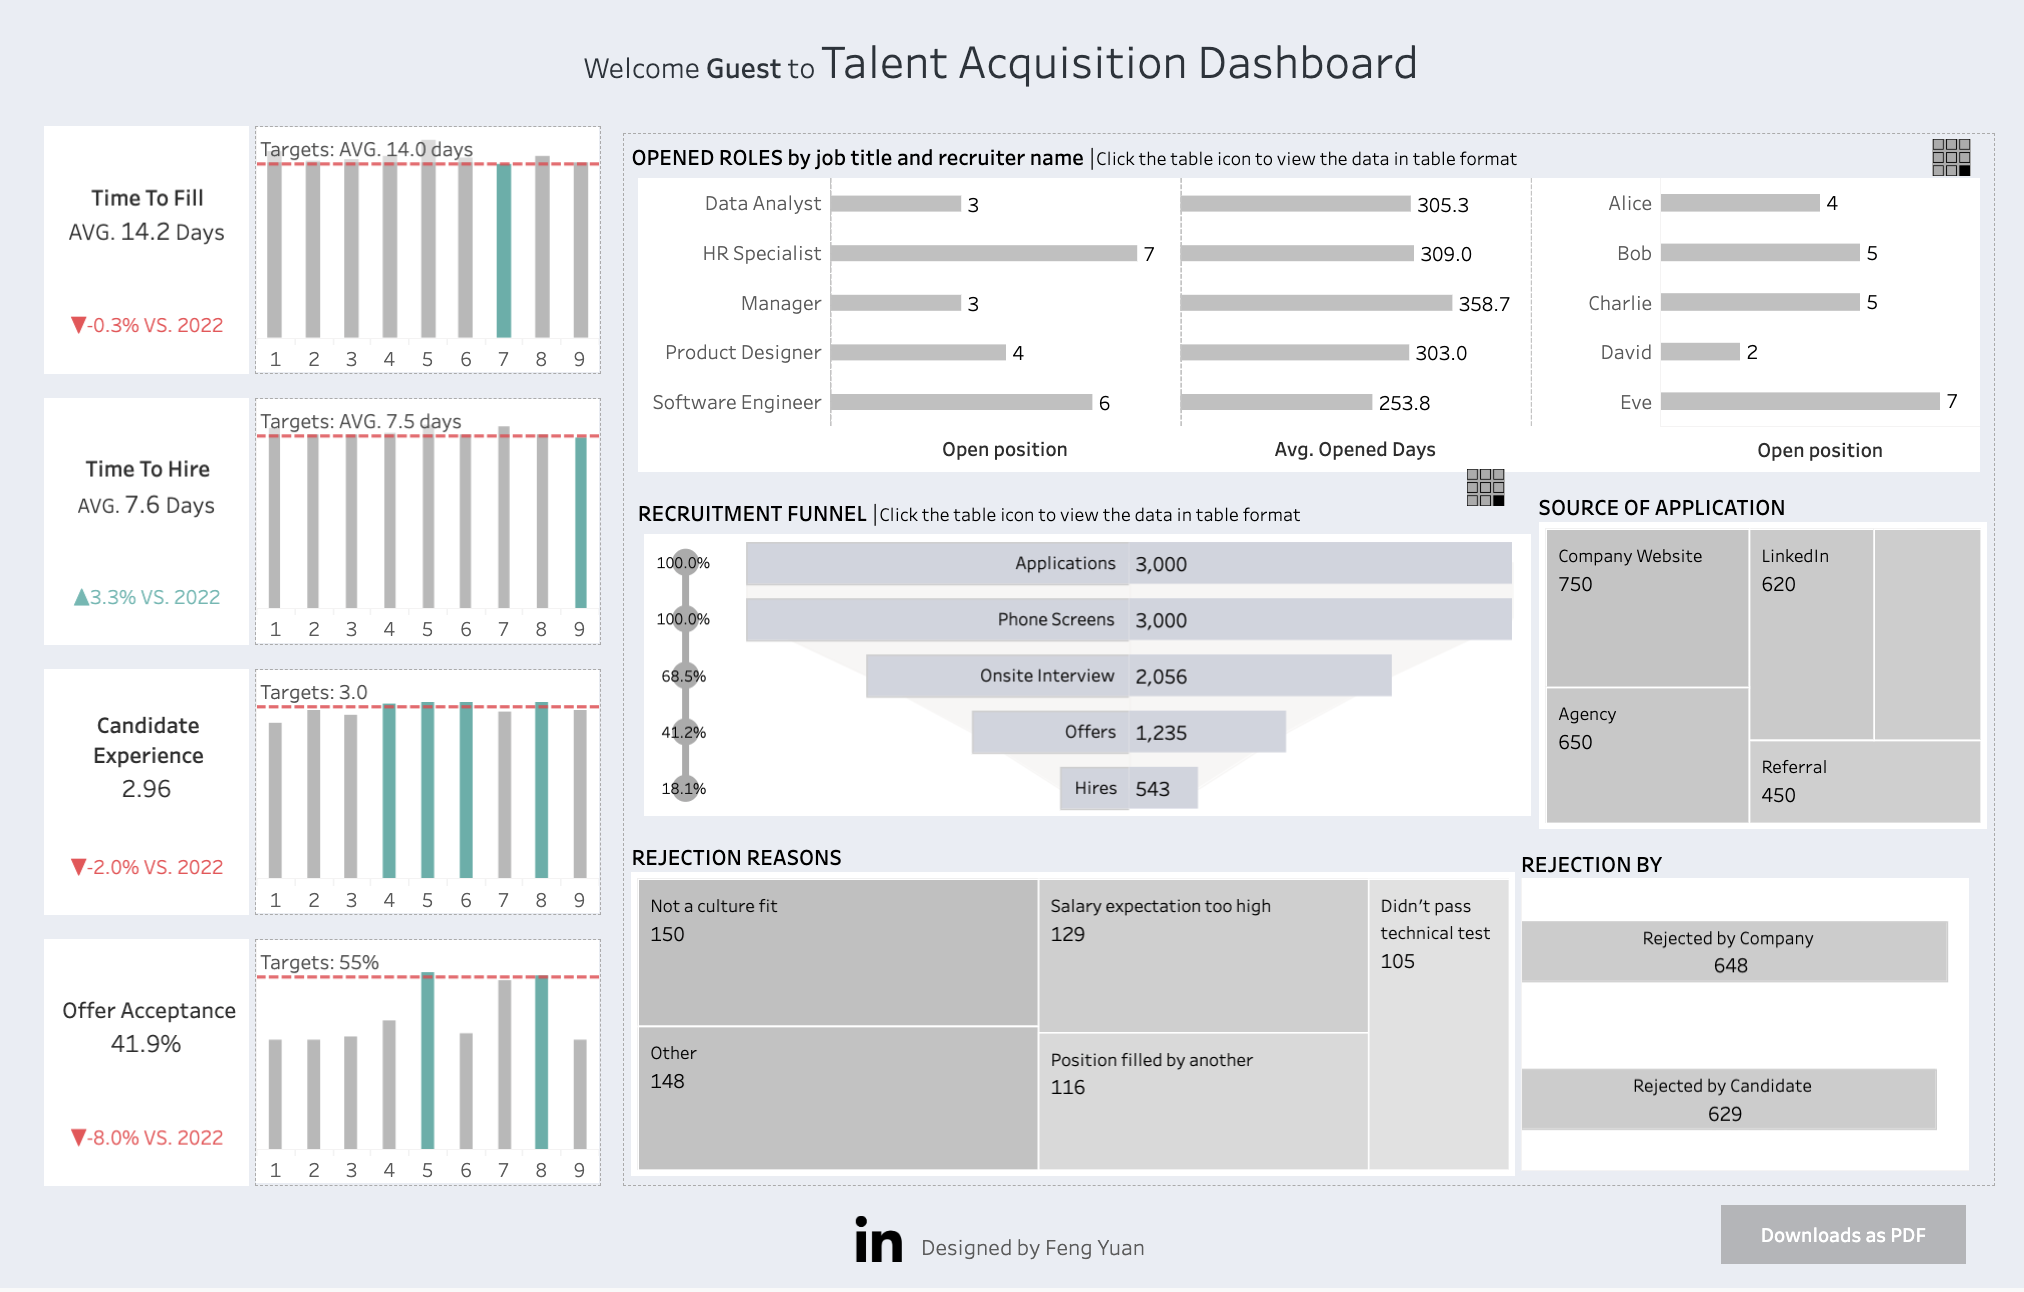
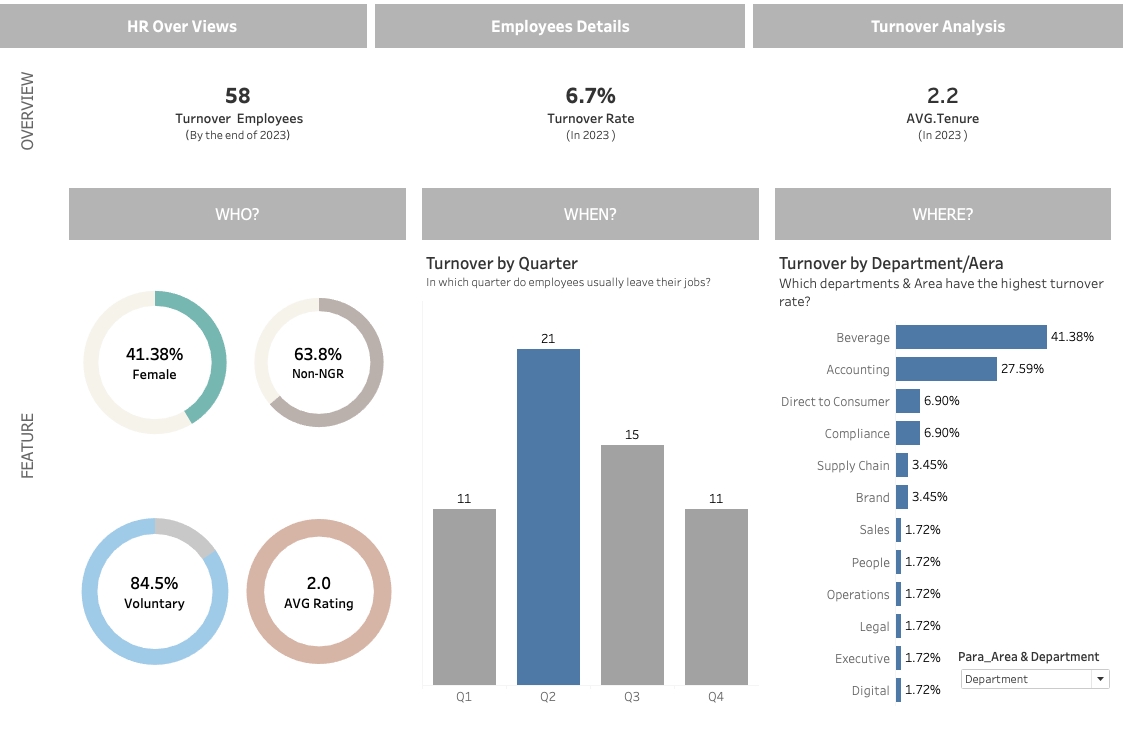
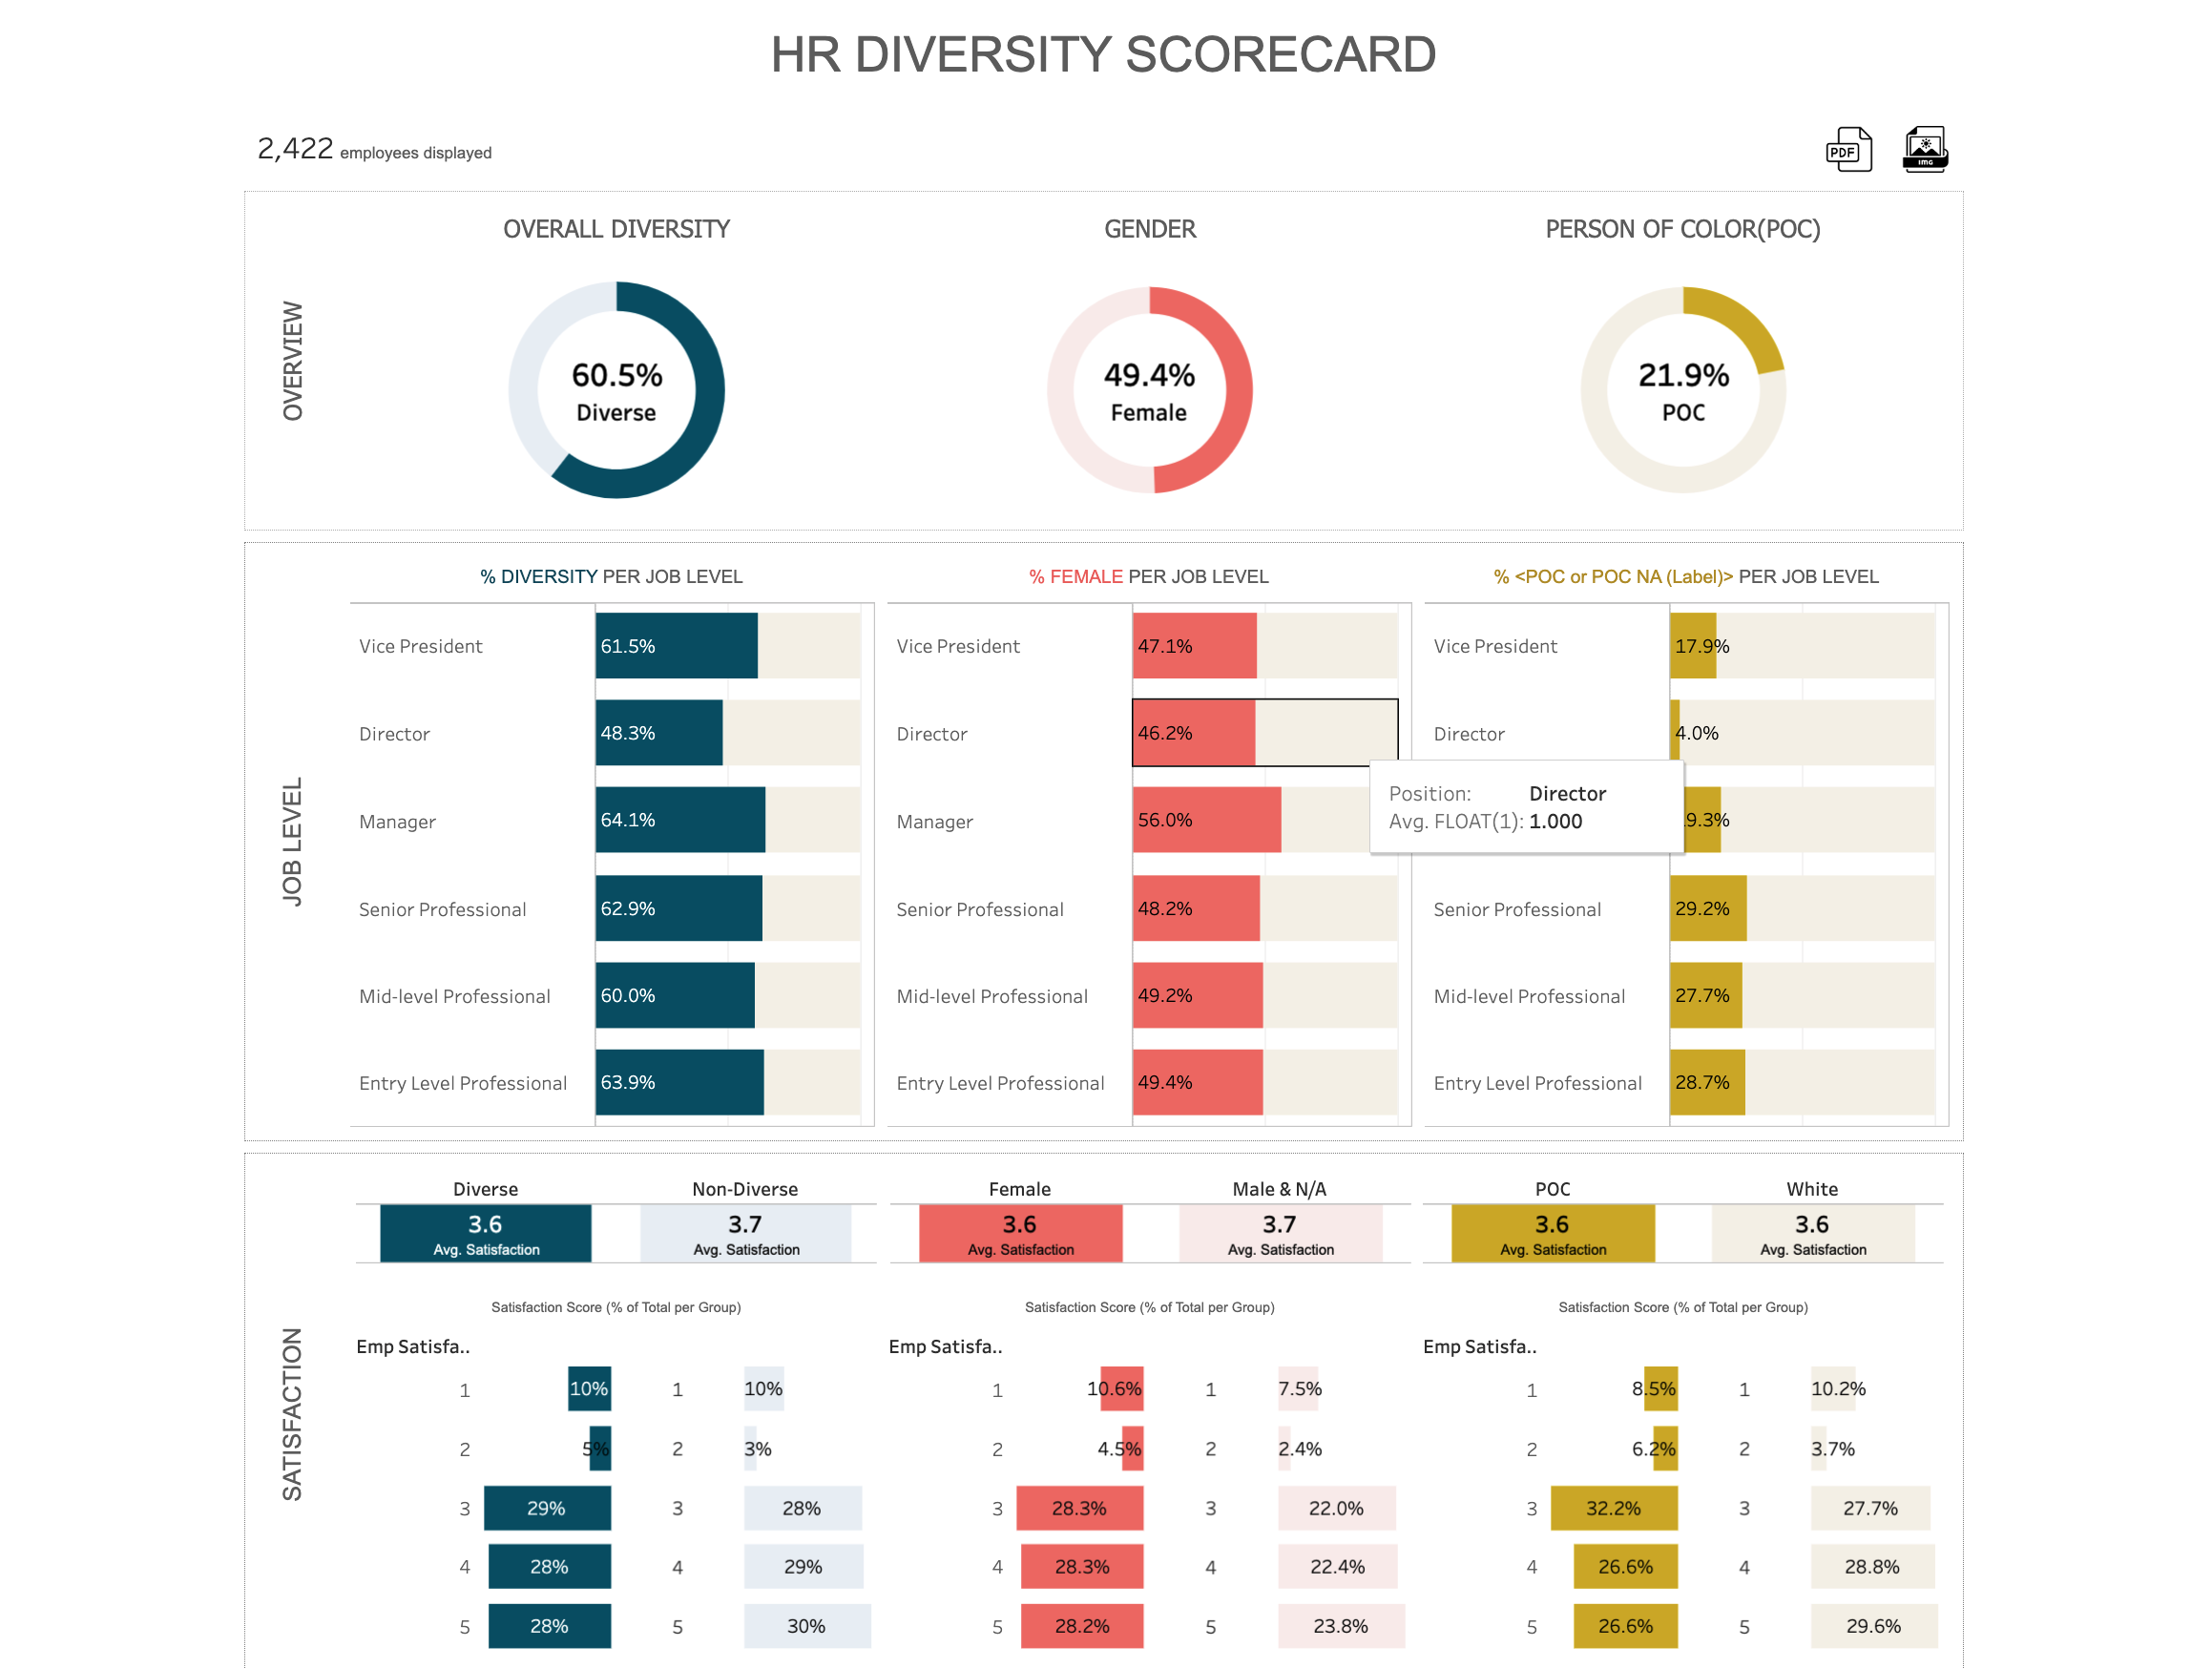
Tableau Dashboard
- Tools: Tableau prep, Tableau Desktop
- Goal: To analysis of employee turnover Trends.
- Analyzing historical HR data.
- Analyze historical data trends of human resources, as well as age, gender and regional distribution.
- Analyze the reasons for employee turnover and provide improvement suggestions.
Skills
Data Analysis
Data visualization
 Power BI
Tools & Technologies
 Google Sheets
 Google Analytics
Education
Lanzhou, China
Degree: B.S. in Chinese Literature
CGPA: 3.8/4.0
- Principles of Database
- Linux Embedded Development
Relevant Courseworks:
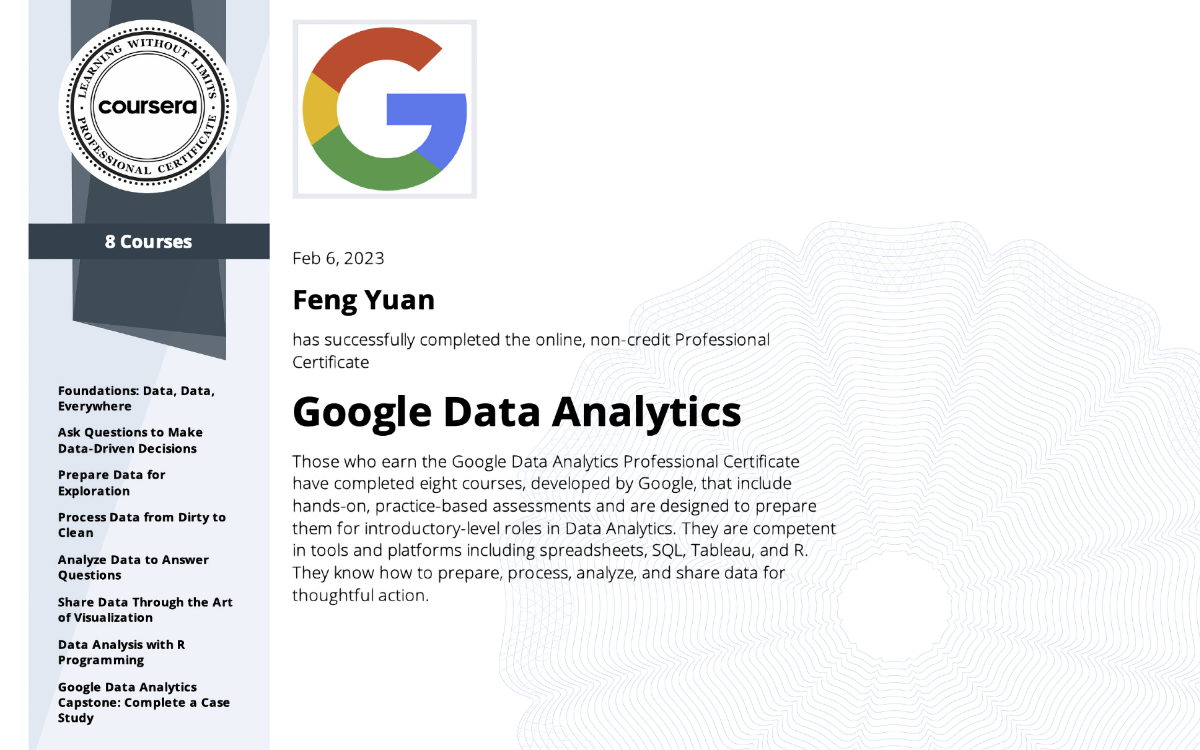
Certifications